A/B test calculator for ads: sample size, days at your budget and significance
An ad A/B test is significant when the difference between the ads is too large to be chance — usually when the p-value is below 0.05, for 95% confidence. To see a lead rate rise from 10% to 13% you need about 1,772 clicks per ad: 36 days at €1 a click and €50 a day. The free calculator below plans a test in impressions, clicks, leads and days, and checks whether a finished test has a winner.
Open the free A/B test calculator for ads ↓
On this page14 sections
Statistical significance calculator for ad A/B tests: sample size and days
A/B test calculator for ads
1. Plan a test: how much data, and how many days?
2. Check a finished test: is the difference real?
| Ad | Impressions | Clicks | Leads | Spend | Reach (optional) |
|---|---|---|---|---|---|
| Ad A | |||||
| Ad B | |||||
| Ad C | |||||
| Ad D |
| Ad | CTR | Click → lead | Cost per lead | Difference vs A | p-value | Verdict |
|---|
Everything runs in your browser; nothing you type is sent anywhere. The first part tells you how many impressions, clicks or leads each ad needs and how many days your budget buys. The second part tells you whether a finished test has a winner. How to set up the test itself in Meta is in our guide to A/B testing Facebook ads on a small budget.
Which metric should an ad A/B test use?
Pick the step closest to money that still gives you enough events. Each step down the funnel is more meaningful and rarer.
| Events per €1,000 | Good for | |
|---|---|---|
| CTR (impression → click) | Hundreds of clicks | Hooks and thumbnails — but a click is not a customer |
| Click → lead | Tens of leads | Landing pages, forms, offers |
| Impression → lead | Tens of leads | Whole-ad tests where the click step does not matter |
| Lead → sale | A few sales | Lead quality; usually too few for a test, use it to veto a winner |
A creative that doubles CTR can still bring worse leads. Read a CTR winner as a candidate, then confirm it on leads or sales.
Why two ads in one ad set are not a fair test
The delivery system shows the ad that looks better early, so the ads end up with different budgets and different people. Google says so about its own rotation setting:
These ads show more often, resulting in higher ad-served percentages
Even a proper experiment does not split spend exactly. For Performance Max experiments, Google tells advertisers not to worry about a gap of up to a fifth:
If the spend discrepancy remains under 20%, it is considered normal auction behavior and we recommend not intervening.
Use the platform’s own test tool so that each person sees one version: Meta A/B test, Google Ads experiments, TikTok Split Test, LinkedIn A/B test. Google can split by search or by cookie; with a split by search, the same person can land in both groups (Google). The calculator warns when spend differs by more than 20%.
A/B test sample size calculator: how many clicks or leads per ad?
It depends on the smallest difference you care about. The standard formula for two rates, at 95% confidence and 80% power, is:
n per ad = (1.96 + 0.84)² × [p₁(1 − p₁) + p₂(1 − p₂)] ÷ (p₁ − p₂)²
p₁ is today’s rate and p₂ the rate you hope to see (Kim, 2016). Halving the difference makes the test about four times larger.
| From → to | Needed per ad | |
|---|---|---|
| CTR | 1.0% → 1.2% (+20%) | 42,691 impressions |
| CTR | 1.0% → 1.5% (+50%) | 7,747 impressions |
| Click → lead | 10% → 13% (+30%) | 1,772 clicks |
| Click → lead | 10% → 15% (+50%) | 683 clicks |
| Click → lead | 10% → 20% (×2) | 197 clicks |
| Three ads, each vs the control | 10% → 13% | 2,145 clicks |
Run whole weeks so every weekday is counted; the Microsoft experimentation team recommends at least a week or two and then multiples of a week (Kohavi et al., 2007). If sales close weeks after the click, wait that long before you read the test.
How long should an ad A/B test run on a small budget?
Divide what the test needs by what your budget buys. At €1 a click and €50 a day per ad, 1,772 clicks take 36 days. Meta and TikTok stop a test after 30 days (Meta, TikTok), so that test cannot finish.
The calculator turns the question around: “Smallest difference 30 days can show” is the effect your budget can detect at all. If it says +60%, testing two shades of the same headline is a waste — test a different offer, form or idea instead.
A rule of thumb from TikTok
TikTok’s marketing blog suggests a test budget of at least 20 times your usual cost per conversion (TikTok). It is a heuristic, not a calculation; the formula above tells you whether it is enough for the difference you want.
How do you know if an A/B test result is significant?
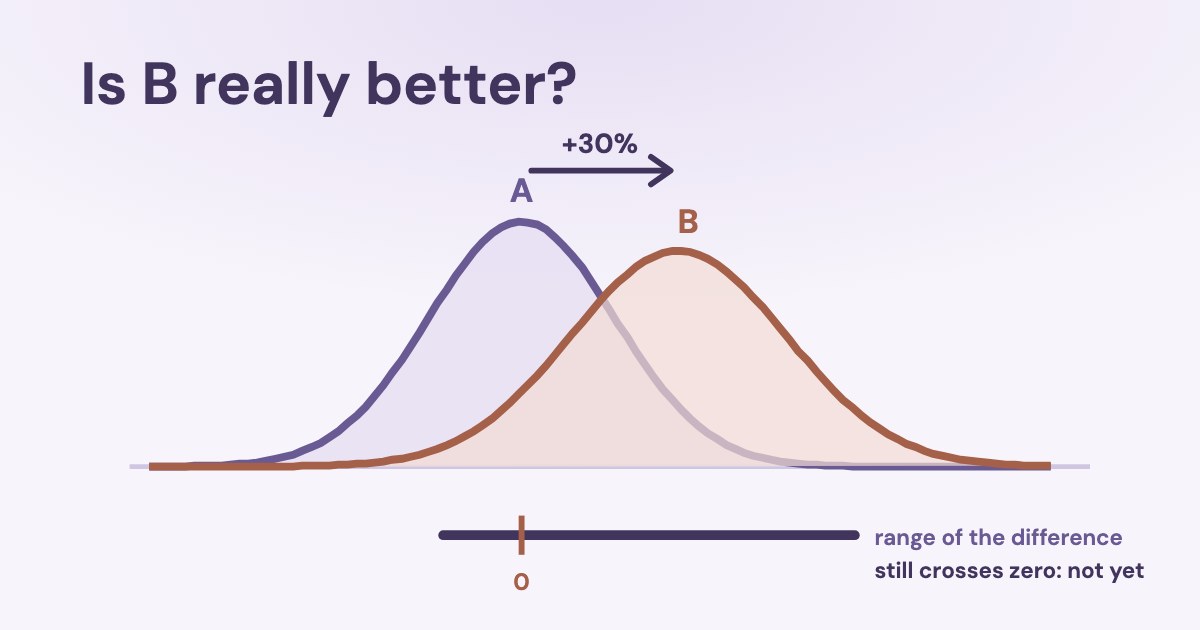
For CTR and conversion rates, compare the two shares with a two-proportion z-test (NIST). Then look at the range of the difference rather than a yes/no: if it includes zero, the ads may be equal (Stat Trek).
Example: 37.5% better, but not proven
Ad A: 40 leads from 400 clicks (10%). Ad B: 55 from 400 (13.75%). B looks 37.5% better, yet z = 1.64 and p = 0.10; the 95% range of the difference runs from −0.7 to +8.2 percentage points. The test needs more clicks before you pick B.
The calculator shows the same range relative to ad A: from −7% to +82%. It calls a result significant when the p-value is below the threshold it prints under the table; the range then leaves zero out. Both the test and the range assume at least 10 events and 10 non-events per ad; below that, the calculator marks the result as a hint.
Can you check A/B test results every day?
You can look, but stopping the moment a result turns significant inflates false winners.
if you peek at an ongoing experiment ten times, then what you think is 1% significance is actually just 5% significance.
Optimizely’s simulations show the same: checking after every 500 visitors raised the chance of a false winner to 26% (Optimizely). Fix the sample size in advance, or use a sequential rule designed for daily checks, such as Evan Miller’s simple sequential test — which assumes an even 50/50 split, rarely true for ads.
What if you test three or more ads?
Each extra ad is one more chance for a false winner. The simplest fix is Bonferroni: divide the significance level by the number of comparisons (NIST). With three ads, each compared with the control at 2.5% instead of 5%, a 10% → 13% test needs 2,145 clicks per ad instead of 1,772. The calculator applies this automatically when you fill rows C or D.
Why CTR tests look more certain than they are
The platform splits people, but CTR counts impressions. One person who sees an ad three times gives three impressions that are not independent, and the usual tests assume they are.
the responses (or analysis units) are at a more granular transaction or item level than the randomization units, which are at a user level.
In practice: with a frequency above 1.5, prefer unique link clicks divided by reach, or test click → lead. Enter reach in the calculator and it warns you. See also what frequency means for Facebook ads.
How do you compare cost per lead between two ads?
Cost per lead is spend divided by leads: both numbers vary, so a test for rates does not apply. If spend was equal, compare the number of leads or the click-to-lead rate. If spend differed, compare leads per unit of spend: given all the leads, each ad’s share should match its share of spend when the ads are equal. The calculator uses this test for “Leads per unit of spend”.
Sales from a CRM are usually too few per ad for any test. Use them to veto a winner picked on leads — a variant with cheap leads that never buy — rather than to pick one. How much a cost per lead moves by chance alone is shown in our Facebook A/B test guide.
How Meta, Google, TikTok and LinkedIn decide a winner
| How it splits | Confidence | Length | |
|---|---|---|---|
| Meta A/B test | Random groups without overlap (Meta) | Not published; shows a “chance of winning” | 7 to 30 days (Meta) |
| Google Ads experiments | By search or by cookie | 80% by default, you can choose (Google) | Shopping experiments: at least 4–6 weeks, the first 7 days discarded |
| TikTok Split Test | Two equal groups, one ad group each | 90% (TikTok) | 7 to 30 days |
| LinkedIn A/B test | Two groups; some members may land in both | Set by you; LinkedIn recommends at least 90% (LinkedIn) | 2 weeks to 90 days (LinkedIn) |
That is why a platform can name a winner when this calculator says “not clear”, or the other way round: different confidence levels, different metrics (LinkedIn decides on cost), and some re-evaluate the result every day.
How does Variafy help with ad tests?
Variafy connects Meta, Google Ads, LinkedIn and Microsoft ad accounts and your CRM to ChatGPT or Claude. It lists your Meta A/B tests and compares their cells over the test window — Meta does not return the winner through its API — and it can pull impressions, clicks, leads and spend per ad for any dates to paste into this calculator — then check the winner against paid deals from your CRM, which Ads Manager does not see. Its reports also say how far a cost per lead can move by chance compared with the last 30 days, so you do not react to noise.
How we checked
Checked on 23 Oct 2026 against the NIST/SEMATECH e-Handbook of Statistical Methods (two-proportion test, Bonferroni), Stat Trek (interval for a difference in proportions), Kim (2016) on sample size for two proportions, Evan Miller on peeking and sequential tests, Kohavi et al. (2007), Liu & McCoy (2023), Optimizely’s documentation, Meta Business Help on A/B tests and the experiment pages of Google Ads, TikTok, LinkedIn and the Meta Marketing API. We compared ten free A/B calculators found through web search; none worked in impressions, spend and days.
The sample sizes in the tables were computed with the formula above and checked with a script. The leads-per-spend test treats leads as counts in proportion to spend and uses an exact binomial test for up to 2,000 leads.
Questions
How do I know if my ad A/B test is statistically significant?
Compare the share of clicks or leads per ad with a two-proportion z-test. If the 95% range of the difference does not include zero, the gap is unlikely to be chance.
How many conversions do I need per ad?
It depends on the difference you want to detect: about 200 clicks per ad to see a lead rate double from 10% to 20%, about 1,800 to see 10% → 13%. Below 10 conversions per ad, treat any result as a hint.
Can I test two ads in the same ad set?
Not fairly. Delivery favours the early leader, so the ads get different budgets and different people. Use the platform’s A/B test or experiments tool.
What confidence level should I use for ads?
95% for changes you will scale; 90% is acceptable for cheap, reversible changes. Google Ads defaults to 80%, TikTok uses 90%, and LinkedIn recommends at least 90%.
Why does Meta show a winner when the calculator says not clear?
Meta reports a chance that the leader would win again on cost per result; it has no fixed pass mark like 95%. Different metrics and thresholds give different answers.
Can I check results every day?
You can look, but do not stop the moment the result turns significant: that multiplies false winners. Fix the sample size in advance, or use a sequential rule.
How long should an ad A/B test run?
At least 7 days and in whole weeks. Meta and TikTok cap tests at 30 days and LinkedIn at 90; Google recommends 4–6 weeks for Shopping experiments.
How do I compare cost per lead between two ads?
With equal spend, compare the number of leads or the click-to-lead rate. With unequal spend, compare leads per unit of spend. Cost per lead itself is a ratio and needs that kind of test.
What if I test three or more ads?
Divide the significance level by the number of comparisons with the control (Bonferroni). Three ads need about 21% more data per ad, four about 33%, five about 42%.
What is a p-value?
The chance of seeing a difference at least this large if the two ads were in fact equal. Below 0.05 is the usual bar for 95% confidence.
What is the minimum detectable effect?
The smallest difference the test is planned to find reliably, for example a lead rate rising from 10% to 13%. Smaller effects need far more data.
What is statistical power?
The chance that the test finds a real difference of the planned size. 80% is the usual choice: one real effect in five is missed.
Should I use a one-sided or two-sided test?
Two-sided, unless you would never act on the new ad being worse. The calculator uses two-sided tests.