Why is my Facebook cost per lead going up — and what’s a good CPL?
First check whether the rise is real: with a few dozen leads, a week that looks 25% more expensive is often just chance. If it is real, cost per lead breaks into three numbers — the price of impressions, how many people click, and how many of them leave their details — and the one that moved tells you where to look. There is no universal “good” cost per lead: work out the most a lead can cost from your own sales.
On this page11 sections
First: is it more than chance?
Leads arrive at random. Even if nothing changed — same ads, same spend, same real cost — the count in a week moves up and down, and cost per lead moves with it. The fewer leads, the bigger the swing:
| Looks 25%+ more expensive | Looks 50%+ more expensive | |
|---|---|---|
| 10 leads a week | about 1 week in 3 | about 1 in 8 |
| 20 leads a week | about 1 in 5 | about 1 in 15 |
| 30 leads a week | about 1 in 6 | about 1 in 30 |
| 50 leads a week | about 1 in 12 | less than 1 in 100 |
How we got these numbers
Our calculation, not client data: when results arrive at random at a steady rate, their count follows a Poisson distribution. We asked how often a week with the same spend and the same real cost brings 20% fewer leads (cost looks 25% higher) or a third fewer (cost looks 50% higher).
Meta gives the same advice in its own words: Analyze performance over at least a full week to help understand if you’re getting a relatively steady amount of results.
(source) And while an ad set is still learning,
your costs aren't necessarily indicative of future performance.
(source)
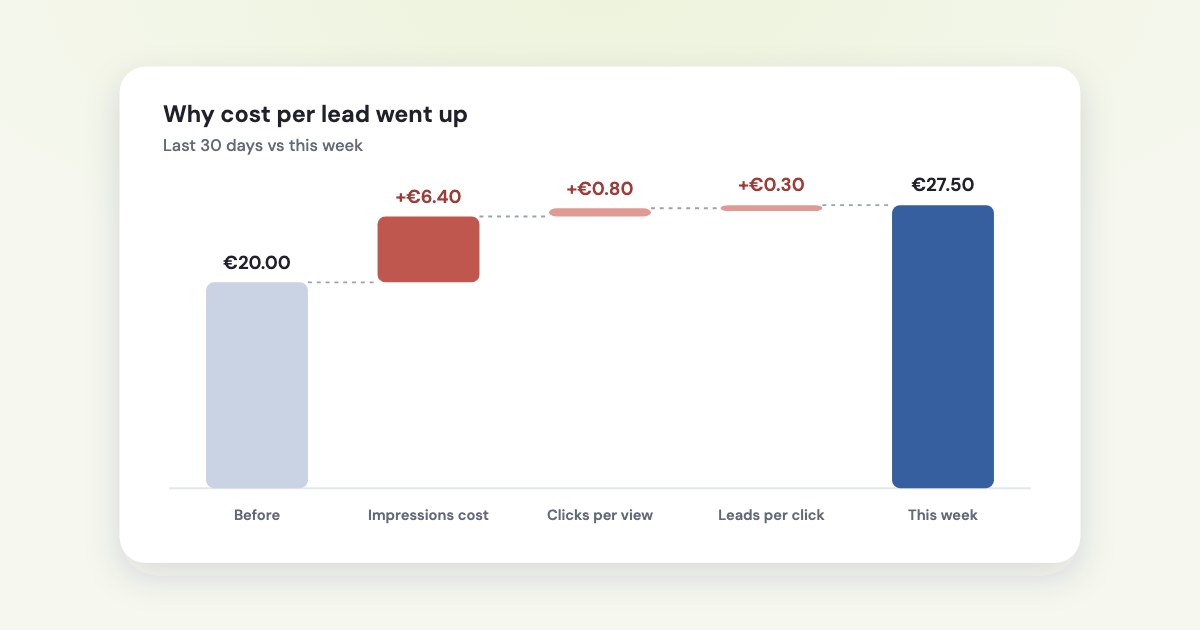
Cost per lead is three numbers
Every lead goes through the same steps: someone sees the ad, clicks, and leaves their details. So:
Cost per lead = CPM ÷ (1,000 × click-through rate × share of clicks that become leads)
With a €10 CPM, 1.5% of viewers clicking and 1 in 10 of them leaving details, a lead costs €10 ÷ (1,000 × 0.015 × 0.1) = €6.67. Each step moves the result in proportion: impressions 30% dearer means leads 30% dearer; a click-through rate that falls from 1.5% to 1.2% makes each lead 25% dearer.
- CPM up — the auction got pricier: competition, season, a narrow audience, lower ad quality.
- Click-through rate down — the ad stopped working on this audience: usually creative fatigue.
- Fewer clicks become leads — the form or the page after the click, or tracking that stopped counting.
A high CPM alone isn’t a problem
On a campaign optimised for leads, Meta may buy expensive
impressions on purpose: the system may go after impressions with a higher cost, if that’s how we can achieve lower conversion prices.
(source) Judge the cost per lead, not the CPM.
The causes Meta names
Meta has a help page for exactly this question, “Your costs are too high”, plus notes on budgets and on prices that grow over time. Put together:
| How to spot it | What helps | |
|---|---|---|
| Learning phase | A new or edited ad set, status “Learning” | Wait for about 50 results in a week; avoid big edits |
| Creative fatigue | Status “Creative limited” or “Creative fatigue”; clicks fall as frequency rises | A new ad that looks clearly different; keep the old one running |
| Bigger budget | Costs rose right after a large budget increase | Let it leave learning; it may settle or stay higher |
| Narrow audience | A small audience, frequency climbing | Broaden the audience or merge ad sets |
| Ad quality | Quality ranking below average | Improve the ad and the page after the click |
| Broken tracking | Your CRM has more leads than Ads Manager | Check the pixel and the Conversions API |
| Competition | CPM up across all campaigns at once | Often seasonal; judge by cost per sale |
Three of these deserve Meta’s exact words. On budget:
Your cost per result may increase because your budget is significantly higher than usual.
The system buys the
cheapest opportunities first, then moves on to dearer ones, and This may be a temporary or sustained increase
(source). On quality: we subsidize relevant ads in the ad auction, so more relevant ads often cost less and see more results.
On tracking: Issues with your data source setup can lead to a lower volume of attributed events and an increased cost per action.
(source)
The quality ranking lives in Ads Manager’s ad relevance diagnostics, next to engagement and conversion rate rankings.
They replaced the old relevance score and need at least 500 impressions (source).
Ads with a lower quality ranking tend to cost more
(source).
The market, or your account?
Meta’s ads get dearer for everyone. In its results for the second quarter of 2026, Meta reported:
Average price per ad increased by 12% year-over-year.
That is an average across all advertisers, not your CPM. Meta’s annual report adds that revenue is
traditionally seasonally strong in the fourth quarter of each year due in part to seasonal holiday demand.
(source) To advertisers it says it plainly: If auction competition increases, costs may go up.
(source)
The test is simple. If CPM rose in every campaign in the same week, it’s the market or the season. If one campaign got dearer while the rest held, the cause is inside that campaign.
What frequency is too high?
There is no official number. Meta’s own research says there is no “magic frequency level” that we can prescribe for every brand and campaign
(source), and its help page says frequency may average 1 to 2 per ad set or may be much higher, depending on your budget, audience size and schedule.
(source) Numbers like “keep it under 3” are bloggers’ rules.
What Meta does give is a signal — performance dropping as frequency rises — and two delivery statuses based on cost (source):
- Creative limited — cost per result is higher than your past ads, but less than twice as high.
- Creative fatigue — cost per result is twice as high or more.
The fix is a new ad that is truly different. Since late 2025 Meta treats look-alike ads as one:
When multiple ads look or feel alike, these are seen as variations of the same creative
(source). A new headline on the same picture is likely to count as the same
creative.
When the number misleads
- The “expensive” placement or ad set is often right. Meta calls it the breakdown effect: the system aims for the lowest cost overall, not per placement. In Meta’s example, switching off the dearer placement gives 8 results for $26 instead of 9 for $27 (source). Judge at campaign or ad set level (source).
- The counting changed. Since March 2026, click-through attribution for website conversions counts only link
clicks, and Meta warned that
advertisers may begin to notice changes inside Ads Manager reporting.
(source) If your leads come from a website form, part of them may have moved to another attribution column. Leads from Meta’s own instant forms aren’t website conversions. - The last two days aren’t finished. Leads from people who saw the ad earlier keep arriving, so yesterday’s cost per lead can still change. Compare complete days.
What is a good cost per lead?
Meta doesn’t publish industry benchmarks. The most careful public one is WordStream and LocaliQ’s 2026 report: an average of $27.39 per lead across 452 US lead campaigns from April 2025 to June 2026, with at least four campaigns per industry (source). For businesses that sell through leads (source):
| Average cost per lead, US, 2026 | |
|---|---|
| Real estate | $13.74 |
| Education and instruction | $26.31 |
| Physicians and surgeons | $32.14 |
| Personal services | $38.09 |
| Home and home improvement | $42.95 |
| Dentists | $61.56 |
Other sources measure differently and land elsewhere — global medians or other months put the “average” around $44–49. Outside the US, prices differ again. A benchmark tells you whether you’re in the right range, not whether your leads are worth it.
Work out your own ceiling
The most a lead can cost = what one sale earns you × the share of leads that buy. A course that leaves you €300 per sale, bought by 1 lead in 15, can afford up to €20 per lead. Above that you lose money however “normal” the number looks; below it, a dearer lead can still be the better buy.
That is also why the cheapest leads aren’t always the best. Meta’s Higher intent instant form adds a review screen to
prevent receiving submissions from those people who are only marginally interested
(source). Which ads bring leads that pay is a question for your CRM — see
which Facebook ads bring paying customers.
How to bring it down
Meta’s own suggestions, with the numbers it publishes:
- Let the ad set finish learning before changing anything — Meta calls it the first step (source).
- Broaden the audience and merge similar ad sets, so each gets enough results to learn. Meta advises against cutting
segments or placements
just because it has shown higher costs to date
. - Use all placements and a broad audience. In a Meta experiment, Advantage+ placements gave an
11.7% lower cost per action (CPA) on average
(source). For Advantage+ audience Meta quotes9.7% lower cost per result
with the Leads objective, without saying how it measured it (source). - Refresh the creative with ads that differ in look and message, not just wording.
- Fix the step that moved. If clicks hold but fewer turn into leads, look at the form or the page, and at tracking.
Meta reports that lead campaigns with Advantage+ turned on had a 14% lower cost per lead across 20 tests (source). These are Meta’s averages from its own tests — check them against your cost per sale.
How Variafy explains a rise
Ask your assistant “Why did my cost per lead go up this week?” Variafy answers from the ad account’s own numbers:
- whether the rise is beyond chance for that many leads, against the last 30, 60 and 90 days;
- which step moved it — the price of impressions, clicks per impression or leads per click — and by how much;
- which campaigns and ad sets pushed it, and whether they got dearer or simply got more of the budget;
- what was edited in those days, from Meta’s change history.
The account audit flags a cost per result that rose 25% or more beyond chance. The creative fatigue check combines frequency (4 for new audiences, 7 for retargeting, over 30 days), a 20% drop in link click-through rate and the ad’s age — starting points you can change, not Meta rules. With sales from your CRM, it never suggests pausing an ad that brings paying customers.
Add https://www.variafy.com/mcp to your assistant. Variafy is in private beta:
join the waitlist.
How we checked
Checked on 15 October 2026 against Meta’s Business Help Center (ad auctions, ad quality, ad relevance diagnostics, “Your costs are too high”, fluctuations in ad performance, reducing cost per result, frequency, creative fatigue, the breakdown effect, Advantage+ placements and audience, instant form types), Meta for Business posts on creative diversification (16 December 2025) and click attribution (3 March 2026), the Advantage+ leads page, Meta’s second-quarter 2026 results and its 2025 annual report, and the WordStream and LocaliQ 2026 Facebook ads benchmarks with their methodology.
The chance table is our own Poisson calculation. Meta publishes no “good” frequency, no industry cost per lead and no seasonal CPM figures for advertisers, so we don’t give any. The thresholds in the last section come from our code. Variafy is our product.
Questions
Why is my Facebook cost per lead going up?
Meta names the usual causes: the ad set is still learning, the creative is fatigued, the budget rose sharply, the audience is narrow, the ad quality is low, tracking lost events, or the auction got more competitive. Split cost per lead into CPM, click-through rate and the share of clicks that become leads to see which one moved.
What is a good cost per lead on Facebook?
Meta publishes no benchmark. WordStream and LocaliQ’s 2026 report puts the US average at $27.39 per lead, from about $14 in real estate to about $62 for dentists. A better test is your own ceiling: what one sale earns you times the share of leads that buy.
What is a good frequency for Facebook ads?
Meta has no official number and says there is no magic frequency level. Watch for results falling as frequency rises, and for the Creative limited or Creative fatigue status, which Meta shows when cost per result climbs above your past ads.
Why is my Facebook CPM so high?
Competition, season, a narrow audience and lower ad quality all raise CPM. On a campaign optimised for leads, Meta may also buy dearer impressions on purpose if they bring cheaper leads, so judge the cost per lead rather than the CPM.
How long should I wait before reacting to a higher cost per lead?
At least a full week, as Meta advises, and longer if you get few leads: with 20 leads a week, about one week in five looks 25% more expensive by chance. Don’t judge an ad set that is still in the learning phase.