Facebook ads breakdowns: age, placement, device, region
In Meta Ads Manager, open Campaigns, Ad sets, or Ads, then click Breakdown between Columns and Reports and select the dimension you need. Use the resulting rows to investigate delivery, not as automatic instructions to remove an age group, device, placement, or region; conversion availability differs by breakdown. [1] [2]
On this page10 sections
How do you add a breakdown?
The following button names follow Meta’s official help read November 4, 2026, as of November 2026. Meta places the Breakdown dropdown between Columns and Reports; the options are grouped by time, delivery, and action. [1]
STEPS: 1. Open Meta Ads Manager. 2. Click Campaigns, Ad sets, or Ads. 3. Set the date range you want to investigate. 4. Click Breakdown. 5. Select Age, Placement, Impression device, or Region from the available options. 6. Read the updated rows alongside the metrics relevant to your question. [1] [2]
Choose the reporting level before interpreting the rows. A campaign-wide result mixes the ads and ad sets inside it, while a narrower view answers a narrower question.
Keep a note of the account, period, selected level, and metric definitions. Without those details, two people can describe the same breakdown as contradictory when they are actually viewing different data.
Meta’s Ads Reporting documentation also describes demographic, geography, delivery, and action categories. Do not assume every dimension can be combined with every other dimension or every conversion metric. [2] [3]
What does each breakdown tell you?
Read the label before naming the business conclusion. As of November 2026, Meta’s documentation distinguishes these delivery and action concepts. [2] [3]
| Breakdown | Question it can help answer |
|---|---|
| Age | Which age ranges did your ads reach? |
| Placement | Where within Meta’s advertising inventory did delivery occur? |
| Impression device | On what device was the ad served? |
| Region | In which regions were the people reached located? |
| Conversion device | On what device did the tracked action occur, where supported? |
Use Age to investigate whether the offer or creative seems to attract different groups. A difference is a reason to review the offer and the evidence, not proof that everyone in an age range behaves the same way.
Use Placement to understand where delivery happened. If your next question is whether to alter placement settings or adapt your creative, continue with the placement guide for lead businesses.
Use device information to investigate the landing experience. If a particular device appears weak, reproduce the form journey on that device before deciding the audience itself is poor.
Use Region to check your delivery geography and commercial fit. A region label does not establish that a person owns a property there, needs service there, or supplied the same location in your CRM.
Why are some conversions missing?
Meta’s reporting help describes a specific list of breakdowns that support web and iOS offsite conversions; we could not open that page to confirm which dimensions it includes. Its API guide documents restrictions on region-level off-Meta action metrics. [2] [3]
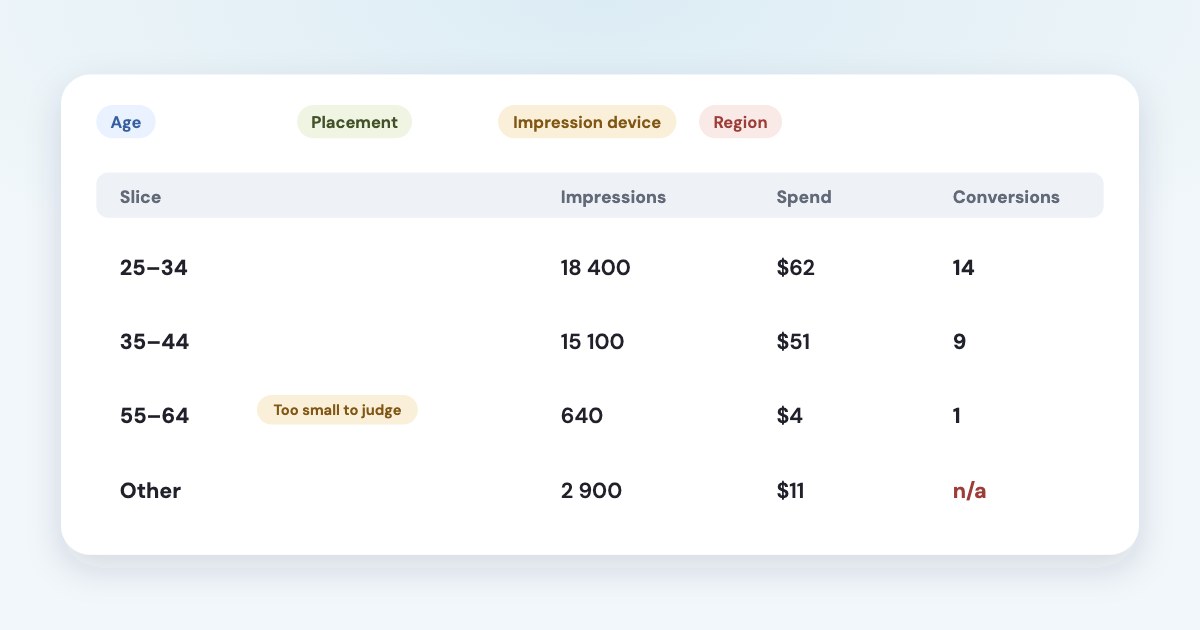
That means a blank website-conversion cell in a region report is not evidence of zero conversions. Keep the delivery question separate from the question of whether the requested conversion detail is available.
Meta says unattributable conversions can appear as Uncategorized and that statistical modeling may be used when conversion data is missing or partial. These are reporting limits, so do not force every reported result into a known row. [2]
The API documentation also notes an availability change effective August 6, 2026, for Impression device on some accounts. It describes an Ads Manager opt-in or an asynchronous API report as possible routes when that API breakdown is unavailable; it does not establish that every account has the same menu state. [3]
If you use an external report, ask which breakdown and action fields it requests. A limitation in that report’s API query may differ from what the Ads Manager interface can display.
Missing is not zero
Do not calculate a regional cost per website lead from a cell the platform does not provide.
Why does splitting the data too thin mislead?
Each extra split leaves less evidence in each row. A result based on a small amount of spend or a few inquiries can change substantially when the next inquiry arrives.
Start with the business question you can act on, such as whether a mobile form is usable or your delivery includes an unserviceable region. Avoid adding every available dimension simply because the menu permits it.
Look at the underlying spend and outcome counts alongside cost per result. A low cost with very little activity may be less useful than a stable pattern that matters to a substantial part of your business.
Do not average the cost-per-result values of several rows to rebuild the total. Recalculate total cost per result as total spend divided by total results, using a consistent result definition.
Give the inquiries comparable time to progress before comparing qualified leads or sales. A row dominated by recent leads should not be declared worse because its sales team has not finished following up.
Also distinguish weak evidence from an operational fault. A broken submit button deserves repair when you can reproduce it, even if the breakdown alone is too small to estimate its financial effect reliably.
When does a breakdown justify a change?
Ask what action the evidence supports. A documented service-area mismatch may justify correcting your settings, while a high cost per click alone may only justify investigating the message and landing experience.
Meta describes the “breakdown effect”: an automated system may allocate more spend to a row with a higher average cost while pursuing a better aggregate result. It recommends evaluating automated placements at the ad set level, and Advantage+ campaign budget at the campaign level. [4]
Do not assume removing the apparently expensive row will preserve all the cheap outcomes elsewhere. The report describes the allocation that occurred, not what would happen under a different allocation.
For an optimization decision, look for a meaningful business impact, a plausible explanation, and comparable evidence over the period you chose. Those are editorial decision criteria, not an official minimum number of conversions or days.
Prefer a change you can evaluate clearly. Repairing a device-specific form issue, clarifying where you operate, or adapting a placement’s creative can be easier to interpret than changing audiences, budgets, and ads together.
If you need to test a hypothesis, use the Facebook A/B testing guide. Write down the outcome that would make the proposed change worthwhile before you run it.
How do you connect the rows to lead quality?
Keep the result definition visible throughout the analysis. A submitted form, qualified inquiry, appointment, and payment are different stages, even if your report presents them beside the same spend number.
When CRM data is available, use it to ask whether the inquiries became useful business. Preserve unknown or unmatched outcomes instead of distributing them across demographic or device rows without evidence.
Do not infer a person’s age, device, or region in the CRM simply to make every ad-platform breakdown balance. If you cannot join the information legitimately and reliably, state that the sales outcome is unavailable at that level.
For the overall reporting framework, use how to read a Facebook ads report. For the distinction between cheap inquiries and useful prospects, use the lead quality guide.
Keep the final recommendation narrow enough to review. “Fix the mobile validation error, then review completed inquiries” is more useful than “mobile performs badly” when the observed problem is the form.
What to do next
Pick one question and one breakdown that can answer it with available metrics. Save the account, dates, level, and underlying spend and results so your comparison can be reviewed later.
Then check the likely cause before changing delivery. If the evidence supports a change, make a specific proposal and assess its effect on the aggregate business outcome, including lead quality and unresolved inquiries.
Where Variafy fits
Variafy connects Meta ad data to an AI assistant and can bring in CRM deals and payments for a business-outcome review. It cannot supply breakdown detail that Meta does not expose; use the available level of evidence. Reading data is free, and ad-account changes are previewed and require confirmation; the free beta is by invitation with sign-up closed. Join the waitlist.
How we checked
Checked on 4 November 2026 against the pages below, read in English. We checked the documentation only: we did not run these steps in a live ad account.
- www.facebook.com/business/help/1098535543548363 — Ads Manager’s Breakdown route and placement/device reporting; read in browser November 4, 2026.
- www.facebook.com/business/help/264160060861852 — Breakdown categories, supported offsite conversions, Uncategorized, and modeling; read in browser November 4, 2026.
- developers.facebook.com/documentation/ads-commerce/marketing-api/insights/breakdowns.md — Dimension definitions, region restrictions, combinations, and August 2026 API availability notice; read in browser November 4, 2026.
- www.facebook.com/business/help/770303663944673 — Breakdown effect and aggregate evaluation levels; read in browser November 4, 2026.
What we could not confirm
- That all metrics support all breakdowns
- That missing regional website conversions mean zero
- That Impression device is available in every account
- A universal minimum sample or reporting period
- Causal proof from an observed row
- That excluding the most expensive row improves the total. No live account report or experiment was tested. A guessed older breakdown-help URL returned a missing page and was discarded
- The current help pages were found through Meta’s Help Center and read in a browser
Variafy is our product.
Questions
How do I add a breakdown in Ads Manager?
Open Campaigns, Ad sets or Ads, then click Breakdown above the results table and choose a dimension such as Age, Placement, Impression device or Region.
Why are conversions missing from my region breakdown?
Meta’s API guide restricts off-Meta action metrics at region level, so regional website-conversion cells can be blank. Use Region to read delivery, and treat a blank cell as unavailable, not zero.
Should I stop an age group or placement that looks expensive?
Not from one table. Small slices and short follow-up make cost unstable, so judge a restriction by the whole campaign’s business outcome.