Facebook Ads to Google Sheets and Looker Studio: reports
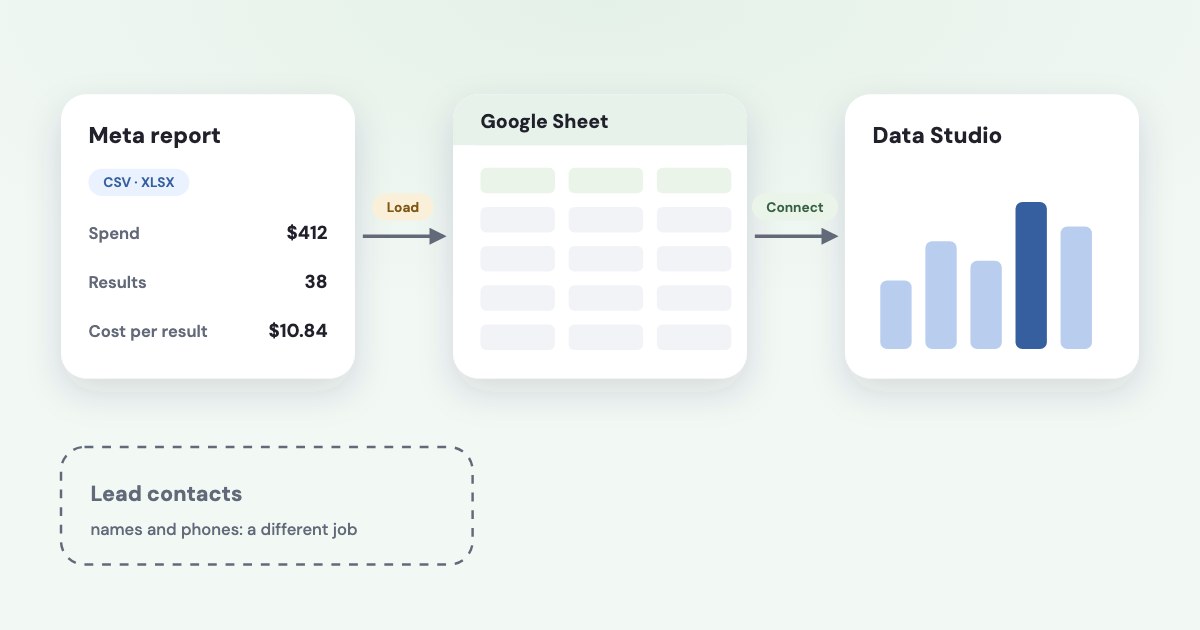
For Facebook Ads reports in Google Sheets, export a Meta performance report and import it, or use a scheduled reporting workflow to load the metrics. Google’s Sheets connector can then display that sheet in Looker Studio, now called Data Studio; it does not fetch Facebook campaign results for you. Google announced the return to the Data Studio name in April 2026. [1] [2] [3]
On this page10 sections
Which route fits your reporting job?
Decide whether you need a one-off file, recurring email or automatically updated table. Each requires a different workflow.
| Route | Cost and work involved |
|---|---|
| Meta CSV/XLSX to Sheets | Manual export and import; no third-party connector required. [1] |
| Meta recurring report | Scheduled email; loading a Sheet remains a separate task. [4] |
| Make reporting workflow | Automatic after setup; Free includes 1,000 credits/month. [6] |
| Zapier reporting workflow | Relevant reporting action requires a paid app and workflow setup. [9] |
| n8n Community workflow | Free self-hosted edition; you operate the infrastructure and integration. [11] |
| Sheets to Data Studio | Displays your loaded sheet; loading the Meta data is separate. [2] |
Define a useful row before choosing a tool. For a campaign report, consider a daily row with account ID, campaign ID, campaign name, currency, spend, the named result metric and its count; this is a suggested reporting design, not a required Meta schema.
If you want people’s contact information rather than performance metrics, use Facebook lead ads to Google Sheets. This guide concerns spend and outcomes at reporting level.
How do you build the manual baseline?
Keep a manual export as your baseline. Compare it with the sheet before debugging the loader and dashboard.
As of November 2026, Meta documents the following export procedure for saved reports. [1]
- Open Ads Reporting.
- Open the saved report by clicking its name.
- Check the report’s date range and selected metrics.
- Click Export.
- Select CSV or XLSX as the required format.
For a new report, Meta documents Ads Manager > Reports > Create report, followed by selecting the ad accounts, Create, a layout and Continue. Configure the report for your question before saving and exporting it. [13]
Google’s current import labels are File > Import, Upload, Select a file from your device, Import location, Separator type and Import data. These labels were read November 4, 2026. [14]
Choose deliberately whether an import replaces a previous snapshot or adds a new period. Keep overlapping exports out of a summed reporting table unless your process updates the existing rows; otherwise the same period can be counted twice.
Assign an import owner and display the last successful update. This route avoids a separate connector subscription.
What does Meta’s scheduled reporting automate?
Meta Ads Reporting supports recurring reports emailed to you and colleagues. Its overview describes customizing the report’s metrics and breakdowns, then scheduling the recurring email. [4]
An emailed report is not a live sheet connection. Verify how the data reaches its actual destination after each scheduled run.
Meta’s public pages read for this article did not establish a universal direct-to-Google-Sheets performance-report schedule or a consistent current scheduling-button sequence. We therefore do not supply invented buttons for such a setup.
Keep recurring email if it meets your need. For an interactive report, choose a loading workflow and use the client reporting guide to define its contents.
Can an automatic workflow stay free?
Make documents a Facebook Insights app that retrieves insights and reporting job results. Its connection setup uses a Facebook Insights module, Create a connection and Save, followed by account authentication when prompted; these labels were checked November 4, 2026. [7]
Request your chosen metrics and update sheet rows by account, campaign and date. A rerun should update the matching row, not add a copy.
Make Free includes 1,000 credits per month and a 15-minute minimum scheduling interval. The live pricing page displayed Core at US$9 per month for 10,000 monthly credits with Annual billing selected, read November 4, 2026; this is a paid annual-billing price, not a month-to-month quote. [6]
Measure actual credit use: Make says module actions consume credits and workflows stop when credits run out. No fixed campaign or refresh count is guaranteed. [6]
For an already configured workflow, Make’s documented scheduling controls are Scenario Builder > Every 15 minutes, then a schedule such as Daily. Its tutorial uses Save and Activate scenario to finish activation; choose your actual reporting time and verify the next run. [8] [15]
Zapier documents Create Ad Statistics Report in Facebook Lead Ads (for Business Admins), which is a premium app. Its Professional starting price displayed US$19.99 per month with yearly billing on November 4, 2026; the ordinary Free plan does not make that app free. [9] [10]
Verify the action’s metrics and reporting level. Its name does not guarantee every field.
n8n offers a free self-hosted Community edition and a Graph API node. You maintain credentials, requests, hosting and failure handling. [11] [12]
How does the sheet become a Looker Studio report?
Google’s current name is Data Studio, formerly Looker Studio, and its standard visualization product is available at no cost. Its first-party connector catalog includes Google Sheets, Google Ads and Analytics, but does not list Meta Ads; community connectors are a separate category. [3] [5]
Use the following documented English labels, read November 4, 2026, once your sheet contains the required table. [2]
- Sign in to Data Studio.
- Click Create.
- Select Data Source.
- Select Google Sheets.
- Select the Spreadsheet.
- Select the Worksheet.
- Click CONNECT.
- Click CREATE REPORT.
- Click ADD TO REPORT.
Google says a Sheets data source connects to one worksheet. Use one header row and keep each column’s data type consistent; check that dates and spend were recognized correctly before designing charts. [2]
Google Cloud’s separate MetaAds Integration Connector requires cloud-project and service-account configuration. It is not a first-party Data Studio connector. [16]
Why can the finished numbers disagree?
Compare the same account, dates, currency, reporting level and result definition at each stage. Preserve the result’s name alongside its count, so a report never adds unlike outcomes under an unexplained Results heading.
For an aggregated cost per result, divide total spend by the total count of the same result. Do not average campaign-level cost-per-result values: that gives each campaign equal weight regardless of how many outcomes it produced.
Keep different currencies separate unless your report has an explicit conversion policy. Also record when each source was retrieved, so readers can distinguish a frozen export from a refreshed dataset.
Compare the Meta export, loading run, saved sheet row and chart filters in that order. Record where the first difference appears.
For interpreting the underlying metrics, see how to read a Facebook Ads report. For business results beyond the selected ad-platform outcome, use matching CRM sales to Facebook ads.
What to do next
Export one report and use it to establish a reconciled sheet. If recurring updates justify the setup, test one automatic reporting workflow and inspect its actual usage, saved rows and update time.
Connect the verified worksheet to Data Studio and check the displayed totals against the baseline. Assign someone to monitor failed loads so a working chart does not hide stale data.
Where Variafy fits
For a scheduled Sheet or dashboard, complete the loading route above. If you want to read ad data in ChatGPT or Claude, Variafy connects your ad accounts to the assistant, with data reading free. It is in a free beta by invitation; sign-up is closed. Join the waitlist.
How we checked
Checked on 4 November 2026 against the pages below, read in English; Meta’s pages were read in a browser. We checked the documentation only: we did not run these steps in a live ad account.
- www.facebook.com/business/help/276601619787641 — Saved-report export, file types and Export button
- docs.cloud.google.com/data-studio/connect-to-google-sheets — Worksheet connection, current procedure and data structure
- docs.cloud.google.com/data-studio/welcome — April 2026 return to Data Studio name and no-cost standard product
- www.facebook.com/business/help/487269218011981 — Reporting features and recurring emailed reports
- docs.cloud.google.com/data-studio/available-connectors — Google’s first-party catalog and separate community connector category
- www.make.com/pricing — Free allowance, credit rules and US$9 Core price for 10,000 credits with Annual billing selected
- apps.make.com/facebook-insights — Insights retrieval and connection labels
- help.make.com/schedule-a-scenario — Scenario Builder schedule controls and Daily option
- help.zapier.com/hc/en-us/articles/8496123584781-How-to-get-started-with-Facebook-Lead-Ads-for-Business-Admins-on-Zapier — Create Ad Statistics Report action and paid-plan requirement
- zapier.com/pricing — Professional starting price with USD and Pay yearly selected
- docs.n8n.io/deploy/host-n8n/community-edition-features.md — Free self-hosted Community edition
- docs.n8n.io/integrations/builtin/app-nodes/n8n-nodes-base.facebookgraphapi — Graph API node and authentication responsibilities
- www.facebook.com/business/help/924647297736315 — Creating a performance report
- support.google.com/docs/answer/12236443?hl=en — File import procedure in Sheets
- help.make.com/step-10-schedule-your-scenario — Save and Activate scenario
- docs.cloud.google.com/integration-connectors/docs/connectors/metaads/configure?hl=en — Separate Google Cloud MetaAds connector and its configuration requirements
What we could not confirm
- A universal native Meta performance-report-to-Sheets schedule or exact current buttons for one; the sources checked establish export and recurring email.
- That Google’s Google Ads connector retrieves Facebook ad data, or that all community connectors are free or paid.
- That a new-lead trigger supplies spend, campaign results or cost per result.
- A guaranteed number of rows, campaigns or refreshes within an automation tool’s free allowance.
- A fixed total cost for self-hosting n8n or using Google Cloud Integration Connectors.
- That an end-to-end reporting workflow was run against a live ad account for this article.
Variafy is our product.
Questions
Can Looker Studio connect directly to Facebook Ads?
Google’s published first-party connector list, read on 4 November 2026, includes Google Sheets and Google Ads but no Meta Ads entry. Load the campaign data into a sheet first and connect the sheet. Google calls the product Data Studio again since April 2026.
Is there a free way to get Facebook Ads results into Google Sheets?
Yes, by hand: export a saved report from Ads Reporting as CSV or XLSX and import it with File > Import. For automatic loading, Make has a free plan with 1,000 credits a month and n8n’s Community edition is free if you host it yourself; Zapier’s reporting action sits in a paid app.
Why do the numbers in my dashboard differ from Ads Manager?
Compare the same account, dates, currency, reporting level and result definition at each stage. For an aggregated cost per result, divide total spend by the total count of the same result; do not average campaign-level cost-per-result values.