Landing page conversion rate: how to measure it and improve useful leads
Landing page conversion rate is the percentage of eligible visits that complete a defined action. For a lead-generation page, a useful session-based definition is sessions with at least one valid enquiry divided by landing-page sessions, multiplied by 100. Name the action and denominator before comparing rates. More form submissions can still mean fewer qualified leads or customers.
On this page11 sections
Why write the rate as a sentence?
Start by writing the number as a sentence: “Five per cent of paid-search sessions landing on this page produced a valid enquiry.” That sentence is much more useful than an unexplained “5% conversion rate”.
How do you calculate landing page conversion rate?
For the session-based definition used here:
Enquiry conversion rate = sessions with at least one valid enquiry ÷ eligible landing-page sessions × 100.
If 1,000 eligible sessions begin on the page and 50 of those sessions produce an enquiry, the rate is 5%. Count a converting session once even if someone submits twice during it.
If you instead measure unique visitors, use converting visitors over eligible visitors. If you measure enquiry events over sessions, label it an event rate; repeated submissions can make it different from the share of sessions that converted.
Google Analytics also distinguishes session-based rates from event counts: its session key-event rate measures the share of sessions in which a key event occurred. Select the intended event rather than assuming that “any key event” means a sales enquiry. See Google’s Analytics report definitions.
| Metric | Numerator | Denominator | Question answered |
|---|---|---|---|
| Enquiry session rate | Sessions with a valid enquiry | Eligible landing sessions | Did the page produce enquiries? |
| Qualified-lead yield | Unique qualified leads | Eligible landing sessions | Did the traffic produce useful prospects? |
| Customer yield | Unique new customers from those leads | Eligible landing sessions | Did the visits eventually produce customers? |
The last two are business funnel yields. They require deduplicated records and a way to connect enquiries to the visits in scope. Keep unmatched records visible instead of allocating them by guesswork.
What is a good landing page conversion rate?
A good rate produces enough valuable outcomes at an affordable cost. The comparison needs a similar offer, traffic source, audience, device mix and conversion definition.
Unbounce reports a 6.6% median across industries in its analysis of Q4 2024 data, covering 41,000 landing pages and a reported 464 million visitors. It is a vendor dataset with varying conversion actions, not a 2026 census of all websites or a lead-to-customer target. Read the original methodology and explanation.
A newsletter signup, emergency repair enquiry and high-value consultation have different friction and intent. A broad benchmark can prompt a question; it cannot diagnose your page.
An economic target is often more useful. Suppose each eligible visit costs $3 and the business can afford $60 in media per valid lead. At those assumed inputs, the required enquiry rate is $3 ÷ $60 = 5%. The calculation requires consistent traffic and lead definitions. It does not show whether those leads will qualify or buy.
If only 20% qualify, media cost per qualified lead at that rate is $300. Check that next stage before declaring 5% a success. Our cost-per-qualified-lead guide explains how to set that economic limit.
First check whether the measurement works
Before changing the headline, walk through the actual enquiry journey on a phone and a desktop. Use a clearly identified test record and exclude it from performance reporting.
Check five points:
- The ad reaches the intended page, with required campaign identifiers preserved.
- The page and form load in the real browser people use, including the in-app browser where relevant.
- Submission succeeds once, and the confirmation reflects a real accepted enquiry.
- The same test reaches the correct business system and responsible person.
- The analytics event is recorded with the expected meaning and counting rule.
Check what happens on a failed submission, refresh and return visit. A thank-you URL that fires on every reload can inflate events. A button click recorded before validation can count failed forms as leads.
Consent choices, browser restrictions and measurement failures can create differences between analytics and CRM totals. A lower measured rate alone does not prove a worse page. Annotate tracking changes and avoid combining the before and after data as though measurement were identical.
Find the first meaningful loss in the journey
Use a funnel whose stages have explicit definitions. For example: ad click → landing session → form start → successful enquiry → qualified lead → customer.
These stages do not automatically share a denominator. A platform click is not an analytics session; a form-start event is not a unique person. Reconcile what is possible and label the remaining gaps.
| Observation | What to investigate first | Useful evidence |
|---|---|---|
| Many ad clicks, few measured landing sessions | Destination, loading and measurement coverage | Real-device journey and tracking diagnostics |
| Visits arrive, few people start the form | Offer clarity, relevance and the next step | Page review and questions from prospects |
| Form starts, few accepted enquiries | Validation, confusing fields and technical errors | Error logs and a completed test journey |
| Enquiries arrive, few qualify | Promise, eligibility and traffic intent | Coded qualification reasons |
| Qualified leads, few customers | Follow-up, appointment availability and offer | Mature CRM stages and sales review |
Fix a reproducible technical failure before running a copy experiment. If the form works, choose the next investigation from the evidence rather than redesigning every section at once.
Improve the page around the visitor's decision
Our practical review asks whether a visitor can answer these questions without searching the page:
- Is this the service and location I expected from the ad?
- Who is it suitable for, and what important limits apply?
- What will happen after I submit, and when should I expect a response?
- Why should I trust this business?
- What information must I provide to take the next step?
Make the ad and page agree on price claims, eligibility, geography and availability. Explain the next step accurately. “Book an appointment” should not secretly mean “send a request and wait for someone to call”.
Ask for the information needed to act on the enquiry. Removing every qualifying question may lift form completion while filling the sales queue with unsuitable requests. Adding unnecessary questions may discourage good prospects. Test the trade-off against useful outcomes.
Check speed and interaction quality as part of the journey. Google’s good Core Web Vitals thresholds are LCP at most 2.5 seconds, INP at most 200 milliseconds and CLS at most 0.1, assessed at the 75th percentile of page loads, separately by mobile and desktop. These are experience thresholds, not promised conversion gains. Google’s Web Vitals guidance explains the measurements.
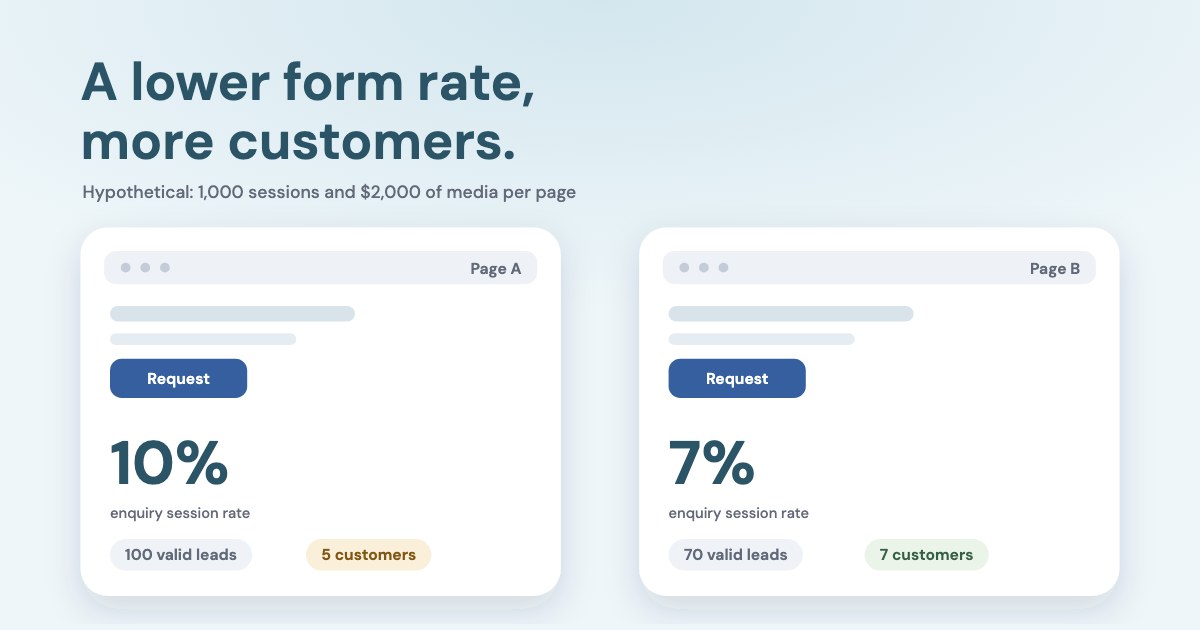
Example: the lower-converting page produces more customers
This fictional comparison assumes one valid lead per converting session, equal media spend and equally mature outcomes. It illustrates the metric trade-off; it is not a causal test result.
| Metric | Page A | Page B |
|---|---|---|
| Eligible landing sessions | 1,000 | 1,000 |
| Media spend | $2,000 | $2,000 |
| Valid leads | 100 | 70 |
| Enquiry session rate | 10% | 7% |
| Qualified leads | 20 | 28 |
| Qualified-lead yield per session | 2% | 2.8% |
| New customers | 5 | 7 |
| Media cost per qualified lead | $100 | $71.43 |
| Media cost per new customer | $400 | $285.71 |
Page A wins on the form rate. Page B produces more qualified prospects and customers in this example. Differences could come from traffic, qualification or the page itself; the table alone does not identify the cause.
For a deliberate test, specify the primary outcome and quality guardrails before starting. If useful leads are too sparse for a reliable comparison, say the result is inconclusive. A spending limit or calendar deadline can end a test without making its result statistically decisive.
Segment before celebrating an improvement
A blended rate can rise even when neither segment improves. Suppose mobile converts at 4% and desktop at 10% in both periods:
| Period | Mobile sessions and enquiries | Desktop sessions and enquiries | Combined rate |
|---|---|---|---|
| First | 800 sessions, 32 enquiries | 200 sessions, 20 enquiries | 52 ÷ 1,000 = 5.2% |
| Second | 400 sessions, 16 enquiries | 600 sessions, 60 enquiries | 76 ÷ 1,000 = 7.6% |
There is no within-device improvement. The traffic mix changed. Use the same check for paid search versus paid social, brand versus non-brand, geography and new versus returning visitors.
Download the page comparison and traffic-mix examples and landing-page test brief. Keep a record of the page version, traffic scope, measurement changes and outcome cutoff.
Put page performance beside ad performance
Variafy can help your assistant read connected advertising data and, where connected, Google Analytics reports. The CRM stages, page changes and custom join needed for this analysis may require your own records; unavailable evidence should remain missing.
Compare spend, clicks and available landing-page or Analytics metrics for this offer. Keep platforms and denominators separate. Use my supplied lead-stage summary to calculate qualified-lead yield, identify the first uncertain step and suggest one bounded investigation.
If you already have access, use the Google Analytics connection guide. Reading a report does not change the page or the ad account.
How we checked
Questions
Is a 10% landing page conversion rate good?
It may be. First identify the action, denominator, traffic and lead quality. Ten per cent completing a low-friction form does not automatically beat five per cent requesting a relevant paid service.
Should I use ad clicks or page sessions?
Use landing sessions for the session-based page rate defined here. Report click-to-session loss separately. Mixing a platform click denominator with an analytics session rate produces different metrics.
Will fewer form fields improve conversions?
It is a hypothesis to test. Evaluate completion and qualification together, and preserve information the team needs to respond.