ROI vs ROAS: the difference, formulas and a worked example
ROAS measures revenue per dollar of advertising. ROI measures the profit left after the costs you include. A campaign can show 4× ROAS and still lose money. To judge an ad campaign, calculate both, write down which costs your ROI includes, and use revenue from the same customer group and observation period.
On this page9 sections
What is the difference between ROI and ROAS?
About the numbers
All business figures below are hypothetical. They illustrate the calculations, not industry benchmarks or Variafy customer results.
| Question | ROAS | Marketing ROI used in this guide |
|---|---|---|
| What does it measure? | Revenue relative to media spend | Contribution left after marketing costs, relative to those marketing costs |
| Numerator | Revenue attributed to the ads | Revenue minus variable delivery costs and marketing costs |
| Denominator | Ad spend | Ad spend plus the other marketing costs you include |
| Usual presentation | A multiple, such as 4× | A percentage, such as 28% |
| Does it include margin? | No | Yes |
| Does it prove the advertising caused the sales? | No | No; attribution alone does not establish that |
There is no useful comparison until the definitions match. An agency might report media-only ROAS, while the owner is looking at the profit after commissions, contractor costs and creative production. Both numbers can be arithmetically correct and answer different questions.
The ROAS formula
ROAS = revenue attributed to advertising ÷ ad spend
If advertising costs $2,000 and the attributed revenue is $8,000:
ROAS = $8,000 ÷ $2,000 = 4×
That is $4 of revenue for each $1 of media spend. It is also 400% when expressed as a percentage. It is not a 400% profit return.
Check what your report calls revenue. A predicted lead value, a signed contract, an invoice and a received payment are different inputs. A conversion-value column is not automatically a statement of collected sales revenue.
The marketing ROI formula
For the decision examples here, use:
Marketing ROI = (revenue − variable delivery costs − marketing costs) ÷ marketing costs × 100%
Marketing costs include media and whichever agency, production and other acquisition expenses you have explicitly allocated. Variable delivery costs are the costs of fulfilling the resulting sales. Keep each cost in one category so it is not subtracted twice.
This is a return on the marketing investment. It is not the business’s complete net profit margin.
Why another ROI calculator may give a different answer
ROI depends on the investment being evaluated. Google’s ROI example includes product costs and advertising in the cost base. A marketing team may instead divide the profit after those costs by the marketing spend alone.
Neither denominator should be hidden. Label your result marketing ROI on $2,500 of acquisition costs or ROI on $7,300 of total included costs, rather than passing an unexplained percentage between teams.
The same 4× ROAS can mean a profit or a loss
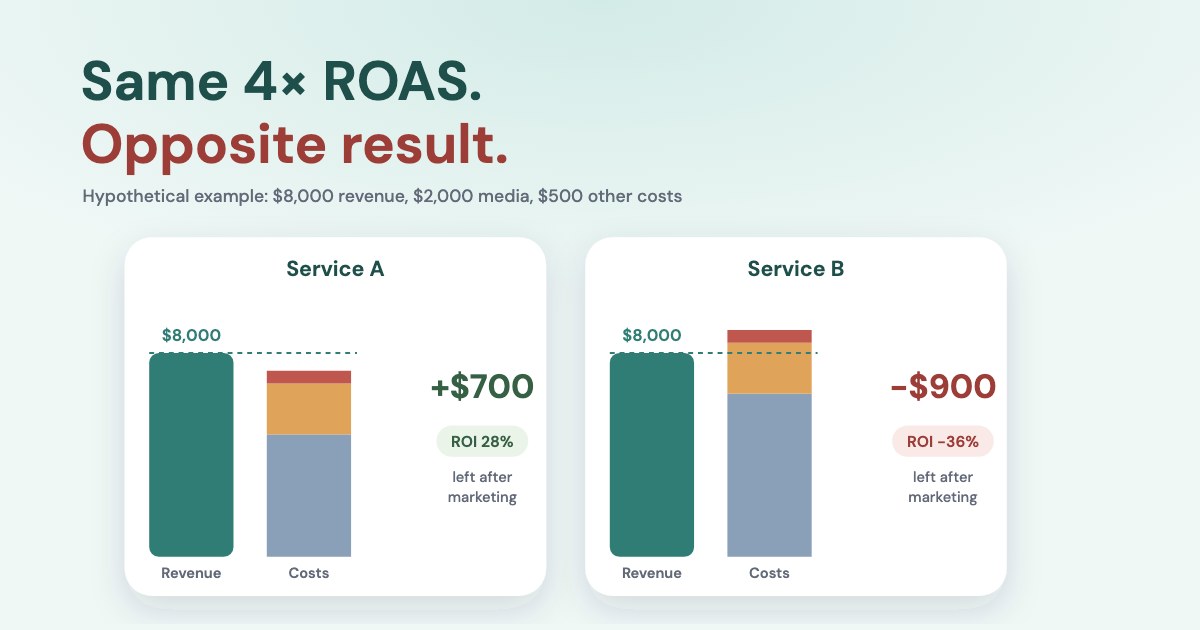
Imagine two campaigns for different services. Each spends $2,000 on ads and produces $8,000 of revenue. Each also has $500 of allocated creative and management costs.
| Input or result | Service A | Service B |
|---|---|---|
| Revenue | $8,000 | $8,000 |
| Variable delivery costs | $4,800 | $6,400 |
| Contribution before marketing | $3,200 | $1,600 |
| Media spend | $2,000 | $2,000 |
| Other marketing costs | $500 | $500 |
| Contribution after marketing | $700 | −$900 |
| ROAS | 4× | 4× |
| Marketing ROI | 28% | −36% |
For Service A, the calculation is $700 ÷ $2,500 = 28%. For Service B, it is −$900 ÷ $2,500 = −36%.
The ad dashboard cannot resolve the difference without the delivery costs. An equally important limitation runs the other way: if the business has unallocated overhead or acquisition expenses, the remaining contribution is not all available to distribute as profit.
Under a total-included-cost ROI convention, Service A would show $700 ÷ $7,300 ≈ 9.6%. That differs from 28% because the denominator changed, not because the campaign changed.
What ROAS do you need to break even?
Start with the contribution margin before marketing:
Contribution margin = (revenue − variable delivery costs) ÷ revenue
With no acquisition costs beyond media, the familiar formula is:
Break-even ROAS = 1 ÷ contribution margin
Enter a 40% margin as 0.40, not 40. The result is 2.5×.
If other marketing costs exist, that shortcut understates the required return. Let S be media spend and F the other marketing costs allocated to the same sales:
Break-even ROAS = (1 + F ÷ S) ÷ contribution margin
Service A needs (1 + 500 ÷ 2,000) ÷ 0.40 = 3.125×. Service B, at a 20% contribution margin, needs 6.25×.
These are arithmetic thresholds for the stated cost model. They do not include omitted overhead, a profit reserve or a safety allowance for uncertain revenue. For a fuller worksheet, use Variafy’s break-even ROAS calculator; for customer acquisition cost, lifetime value and payback by channel, use the LTV:CAC ratio calculator.
If the margin is zero or negative, increasing revenue does not solve this model. If ad spend is zero, ROAS is undefined; display “not applicable,” not zero.
For lead generation, match revenue to the leads that produced it
Suppose September advertising generates enquiries that pay in October. Dividing October cash receipts by October ad spend mixes different groups of customers.
Keep two views:
- Acquisition cohort: leads created in September, the cost of acquiring them, and their subsequent sales or payments through a stated cutoff. Use it to evaluate acquisition performance.
- Calendar cash view: payments received in October and cash spent in October. Use it to manage cash, with the understanding that receipts may come from older leads.
Both are useful. One should not silently replace the other. Record an observation cutoff and distinguish immature cohorts from cohorts that have had a comparable opportunity to convert. The conversion-lag guide explains how recent results can otherwise look worse simply because they are younger.
For instalment sales, do not compare the full contract value from one campaign with the first payment from another. Keep booked revenue, received payments, refunds and remaining balances separate.
Which metric should decide your next action?
| What you see | First check | A reasonable next decision |
|---|---|---|
| Strong ROAS, weak marketing ROI | Delivery margin and non-media costs | Repair the economics before approving more spend |
| Weak recent ROAS, healthy mature cohorts | Sales delay and reporting completeness | Schedule a later review; investigate tracking failures immediately |
| Higher CPL, better downstream sales | Qualified-lead and customer costs | Compare business outcomes rather than rejecting expensive enquiries |
| Both platforms report attractive ROAS | Whether they claim the same sales | Reconcile against a unique sales ledger |
| Profit improves while the ROAS multiple falls | Additional contribution and capacity | Judge the added business value, not just the ratio |
The last row matters. A smaller multiple can accompany more total contribution. The question is whether the additional spend earns an acceptable return, not whether every ratio improves.
Copy this calculation brief
Before someone reports ROI, agree on these fields:
- Cohort or reporting period and observation cutoff.
- Revenue basis: received payments, recognized revenue or booked sales.
- Refund, discount and tax treatment.
- Currency and any exchange-rate convention.
- Media spend, other acquisition costs and variable delivery costs.
- Treatment of repeat customers, instalments and missing source data.
- The exact ROI denominator and the owner’s required profit reserve.
Download the worked ROI comparison, or copy the table above. The example deliberately keeps media and other marketing costs separate.
Check the inputs with Variafy
Variafy brings supported advertising-account reports into an AI assistant such as ChatGPT or Claude. Use those readings alongside your sales data and cost assumptions; an ad-account report does not supply your full profit-and-loss statement.
Try this request:
For this campaign and acquisition cohort, list ad spend, the available revenue evidence and the observation cutoff. Separate received payments from assigned conversion values. Using the costs I provide, calculate ROAS and marketing ROI, show the formulas, and list missing inputs. Do not recommend an increase from ROAS alone.
Start with the Meta connection guide or the Google Ads connection guide. Availability depends on the current beta access and supported connections. Reading the data does not require changing a campaign.
How we checked
Questions
Is a 4× ROAS good?
Only relative to your margin and costs. In this guide, two campaigns both achieve 4×; one leaves $700 after marketing, and the other loses $900. A universal multiple cannot establish profitability.
Can I calculate ROI from ROAS?
You also need the relevant margin and cost scope. For a media-only marketing cost base, marketing ROI as a decimal is ROAS × contribution margin − 1. Add other marketing costs explicitly when they exist.
Should I use revenue or profit in ROAS?
Use the stated revenue basis in the ROAS numerator. If you use contribution or profit instead, label the metric differently so it is not confused with revenue ROAS.
Does positive marketing ROI mean the ads created incremental profit?
No. It is a profitability calculation for attributed outcomes under a cost model. Establishing how many outcomes would not have happened without advertising requires additional causal evidence.
Which result should I send to the business owner?
Send the revenue basis, included costs, contribution after marketing and the labeled ROI percentage together. A single ratio without its cost base is easy to misinterpret.
Related guides
- ROAS calculator: break-even ROAS, CPA and cost per lead for businesses that sell after a lead
- LTV:CAC ratio calculator: CAC, LTV and payback by ad channel for lead businesses
- Cost per qualified lead: the formula, a worked example and your target
- CAC vs CPA: the difference, formulas and a complete cost example