Lead conversion rate: the formula, a funnel example and a practical improvement plan
Lead conversion rate is the percentage of a defined group of leads that reaches a named outcome. For a lead-to-customer rate, divide new customers from that lead cohort by eligible leads in the cohort, then multiply by 100. State the starting stage, ending stage and observation cutoff. A rate from qualified opportunities cannot be compared directly with a rate from all enquiries.
On this page12 sections
Why is one headline percentage not enough?
For a business buying enquiries from Meta or Google, the most useful report explains both the overall customer yield and where the journey loses people. That makes the next action clearer than a single headline percentage.
What does “converted lead” mean?
It might mean a person became qualified, an opportunity was created, a contract was signed or a first payment arrived. Those are different outcomes.
Salesforce’s lead-conversion explanation notes that every company defines conversion a little differently, and advises agreeing on one definition and tracking it consistently. A CRM’s “converted” status is therefore not proof that the person paid.
Define a paying customer in business terms. For example: a unique first-time customer whose first payment was accepted, excluding identified tests and cancelled transactions under a documented rule. If you sell to companies, decide whether the unit is an account, opportunity or individual person.
Keep repeat purchases separate from first-time acquisition. One customer buying two services is not necessarily two converted leads. If multiple contacts can produce one company sale, do not force the data into a one-person, one-customer formula without explaining the mapping.
How do you calculate lead conversion rate?
Lead-to-new-customer rate = unique new customers from the lead cohort ÷ eligible unique leads in that cohort × 100.
If 200 eligible leads produce 12 new customers by the agreed cutoff, the observed rate is 12 ÷ 200 × 100 = 6%.
The denominator should follow a rule chosen before you see the result. One defensible approach is to remove confirmed duplicate records and internal tests, but retain genuine enquiries that turned out to be irrelevant, unreachable or unable to afford the offer. Those failures are part of the acquisition experience.
If you exclude invalid contact details or spam, report both the raw-enquiry count and the eligible count, with the exclusion rule. Otherwise a cleaner denominator can create the appearance of better conversion without producing an additional customer.
Separate website, lead and sales conversion rates
| Rate | Starting point | Ending point | What it helps diagnose |
|---|---|---|---|
| Visitor or session to enquiry | Eligible website visitors or sessions | A defined enquiry action | Traffic and page response |
| Lead to qualified lead | Eligible leads | Documented qualification | Offer fit and acquisition quality |
| Qualified lead to customer | Qualified leads | New customer | Sales progression among qualified prospects |
| Lead to customer | All eligible leads | New customer | Overall acquisition-to-sale yield |
A paid platform’s conversion rate uses its own interaction and conversion definitions. Keep that measure separate from the CRM’s lead-to-customer rate. Google documents its conversion reporting, including the relationship between ad interactions and reported conversions.
If the question is about a page’s visitors rather than existing enquiries, use the landing-page conversion guide.
A complete funnel example
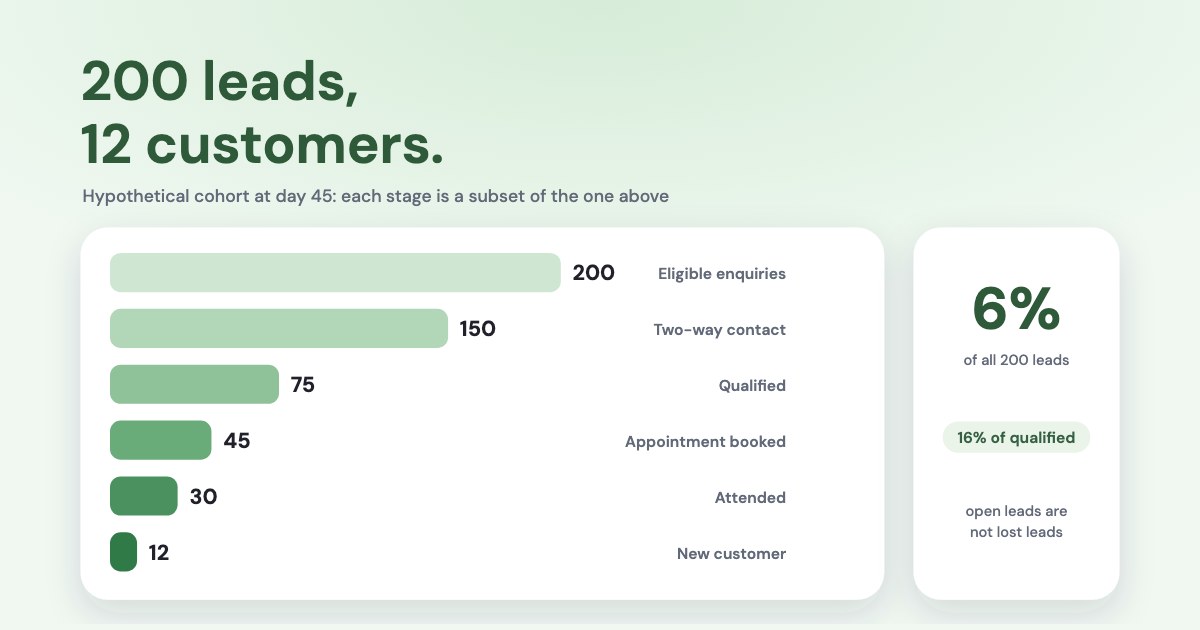
Consider a fictional service business following 200 leads acquired during one week. Counts below mean “reached this stage by day 45”, not “currently sitting in this stage”. Every later stage in this simplified example is a subset of the previous one.
| Stage reached | Leads | Rate from previous stage | Rate from all 200 leads |
|---|---|---|---|
| Eligible enquiries | 200 | — | 100% |
| Two-way contact made | 150 | 75% | 75% |
| Qualified | 75 | 50% | 37.5% |
| Appointment booked | 45 | 60% | 22.5% |
| Appointment attended | 30 | 66.7% | 15% |
| New paying customer | 12 | 40% | 6% |
Multiply the unrounded stage rates to recover the overall rate:
0.75 × 0.50 × 0.60 × (30 ÷ 45) × 0.40 = 0.06, or 6%.
The qualified-lead-to-customer rate is 12 ÷ 75 = 16%. That is compatible with the 6% overall rate; it starts later in the funnel.
Some real buyers skip an appointment, buy through another route or re-enter after a rejection. Use separate paths or direct cohort counts when that happens. Multiplying stage rates is valid for the nested path described here, not every CRM stage layout.
Choose a cohort and give it time
“Customers this month divided by leads this month” mixes journeys if customers began as leads in earlier months. It can be a period activity ratio, but it is not necessarily the conversion rate of this month’s leads.
A cohort report starts with an acquisition window, such as enquiries received from 1–7 October, and follows those same records to a fixed cutoff. Compare cohorts at a similar age: day 7 with day 7, or day 45 with day 45.
For the example above, suppose 60 leads remain open at day 45. The observed rate is still 6%, but the outcome is not final. Report 12 paid, 128 closed without a sale and 60 open, if those are the actual mutually exclusive statuses. Do not silently turn open leads into lost leads.
Changing the acquisition mix can also move the headline. More low-intent enquiries may reduce the overall rate even if the sales team handles each comparable segment just as well. Segment by offer, source, geography and relevant customer type before assigning blame.
The conversion-lag guide explains why recent advertising cohorts need particular care.
What is a good lead conversion rate?
It is a rate that supports the business’s acquisition economics at a workable volume and service standard. There is no useful universal number without matching definitions and a comparable buying process.
Benchmarks called “lead conversion” may measure visitor-to-enquiry, enquiry-to-qualified or opportunity-to-sale. Ask for the numerator, denominator, sample, observation period and qualification rules before using one as a target.
For planning, connect the rate to media cost:
Media CAC = media cost per lead ÷ lead-to-new-customer rate.
At an illustrative $24 per eligible lead and a 6% customer rate, media CAC is $400. At the same lead price and a 4% rate, it is $600. Sales and other acquisition costs still need to be added for a fully loaded CAC; see CAC versus CPA.
This relationship can help set a target. It cannot establish that increasing the lead budget will preserve the same quality and conversion rate.
Improve the stage that limits useful outcomes
Assign a question and an owner to each loss, rather than telling everyone to “improve conversion”.
| Loss | Review question | Possible owner |
|---|---|---|
| Enquiry never reaches the team | Are routing, notifications and assignment working? | Operations |
| No two-way contact | Are details usable and attempts appropriate to the enquiry? | Sales operations |
| Contacted but unsuitable | Does the offer, targeting or form create the wrong expectation? | Marketing and sales |
| Qualified but not booked | Is availability clear and is the next step easy? | Sales |
| Booked but absent | Are time, location and preparation clear? | Scheduling team |
| Attended but not buying | Is the offer suitable and are objections understood? | Sales and product |
Record reasons consistently. “Bad lead” hides important differences between an out-of-area enquiry, someone who misunderstood the price and someone the team never contacted.
For response time, log receipt, assignment, first genuine response attempt and first two-way contact separately. An automatic receipt email is not evidence that a conversation happened. Inspect unassigned leads and delays by working hours; choose a service standard your team can staff.
Do not deliberately delay customer responses to manufacture a comparison. Improve the workflow and evaluate it with appropriately controlled or carefully labelled observational evidence.
Model an improvement before promising it
In the fictional funnel, 45 people book and 30 attend. If attendance rose to 36 while the later 40% customer rate stayed the same, the planning estimate would be 36 × 40% = 14.4 customers, or 2.4 more than 12.
That fractional result is an expectation in a model, not an observed count or a guarantee. The newly attending people may convert at a different rate.
For comparison, increasing contacts from 150 to 170 with every later rate unchanged predicts 13.6 customers, an increase of 1.6. This does not automatically make attendance the better project: compare cost, feasibility, time and customer experience as well.
Choose one change, define the primary outcome and keep the denominator stable. Report the customer count beside the percentage. An improvement from one sale in 20 leads to two in 20 doubles the rate, but remains a small amount of evidence.
Download the funnel example and blank cohort tracker. The tracker uses internal IDs and timestamps; it does not require customer names or message content.
Review the funnel with your assistant
Variafy can help read connected advertising data alongside business outcomes you supply or have configured through supported connections. The full stage history and response timestamps may require your own CRM export. Keep missing stages explicit.
For this lead cohort, calculate contact, qualification, booking, attendance and new-customer rates. Show each denominator, the cutoff and open leads. Use my supplied stage records, compare like-for-like sources and suggest one improvement with an owner and a measurable outcome.
If you already have access, read how to connect Meta Ads. Start with analysis before proposing account changes.
How we checked
Questions
Should I calculate from all leads or qualified leads?
Calculate both and label the starting point. The full lead-to-customer rate includes acquisition quality; the qualified-to-customer rate focuses on a later part of the journey.
Can the conversion rate exceed 100%?
Not for a one-eligible-lead, at-most-one-new-customer model. Check whether you mixed payment events, orders, multiple opportunities or different cohorts.
Can I compare Meta and Google lead conversion directly?
Use the same offer, qualification, customer definition and cohort age, and account for overlap. Their reported platform conversions are not automatically comparable business customers.